Lets-Plot for Kotlin
Overview
Lets-Plot for Kotlin is a Kotlin API for Lets-Plot library - an open-source plotting library for statistical data which is written entirely in the Kotlin programming language.
Here you can find a documentation with examples in form of Jupyter notebook using Kotlin kernel.
Lets-Plot Kotlin API was built on the principals of layered graphics first described in the Leland Wilkinson work The Grammar of Graphics
and later implemented in the ggplot2 package for R.
Lets-Plot in Jupyter with Kotlin Kernel
Installation
Install Kotlin Kernel and OpenJdk in Conda environment:
conda install kotlin-jupyter-kernel -c jetbrainsQuickstart in Jupyter
In Jupyter create new notebook, choose kernel - kotlin.
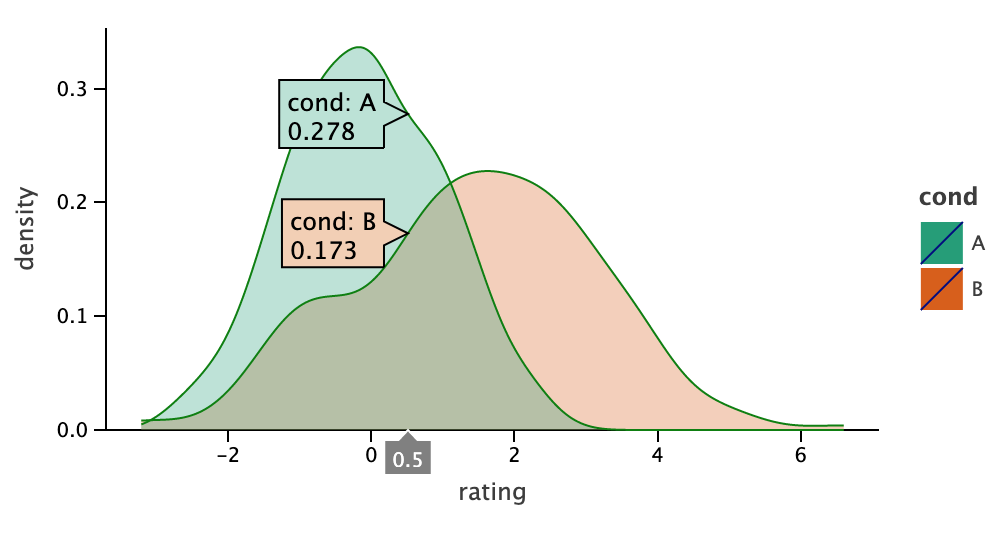
To evaluate the plotting capabilities of Lets-Plot, add the following code to a Jupyter notebook:
%use lets-plot
val rand = java.util.Random()
val data = mapOf<String, Any>(
    "rating" to List(200) { rand.nextGaussian() } + List(200) { rand.nextGaussian() * 1.5 + 1.5 },
    "cond" to List(200) { "A" } + List(200) { "B" }
)

var p = lets_plot(data)
p += geom_density(color="dark_green", alpha=.3) {x="rating"; fill="cond"}
p + ggsize(500, 250)
Resources
- Kotlin for Data Science : overview of Kotlin Jupyter kernel etc.
- Using Kotlin for Data Science : recording of the talk at KotlinConf-19.
Lets-Plot in JVM-based application
Besides Jupyter notebooks, Lets-Plot library and Kotlin API enables embedding plots into a JVM-based application.
See README_DEV.md to learn more about creating plots in a JVM environment.
License
Code and documentation released under the MIT license.
Copyright 2019, JetBrains s.r.o.