mittelmark/snha
St. Nicolas House Algorithm implementation in R - predicting correlation networks using association chains


Snha package
R package which implements the St. Nicolas House Algorithm (SNHA) for
constructing networks of correlated variables using a ranking of the pairwise
correlation values. The package contains the R code for the papers:
- Groth, D., Scheffler, C., & Hermanussen, M. (2019). Body height in stunted
Indonesian children depends directly on parental education and not via
a nutrition mediated pathway-Evidence from tracing association chains by St.
Nicolas House Analysis. Anthropologischer Anzeiger, 76(5), 445-451.
https://doi.org/10.1127/anthranz/2019/1027 - Hermanussen, M., Aßmann, C., & Groth, D. (2021). Chain Reversion for Detecting
Associations in Interacting Variables—St. Nicolas House Analysis.
International journal of environmental research and public health, 18(4), 1741
https://doi.org/10.3390/ijerph18041741
For an implementation of the algorithm in Python look here
https://github.com/thake93/snha4py.
CRAN Statistics
- Downloads - total:
- Downloads - monthly:
- Downloads - weekly:
Installation
Either install the package directly from CRAN as usually:
install.packages('snha')
For installing the latest stable version directly from Github you can execute the following command in your R console:
install.packages(
  "https://github.com/mittelmark/snha/releases/download/v0.2.1/snha_0.2.1.tar.gz",
  repos=NULL);
Thereafter you can load the package and the vignette of the package like this:
library(snha)
vignette("tutorial",package="snha)
citation("snha")
Or to use the latest development version from the Github repository install it like this:
library(remotes)
remotes::install_github("https://github.com/mittelmark/snha")
Example
The package has a function snha where you give your data as input. The
function creates an object of class snha which you can plot and
explore easily. Here an example just using the swiss data which are part of
every R installation:
> library(snha)
> library(MASS)
> data(swiss)
> colnames(swiss)=abbreviate(swiss)
> as=snha(swiss,method="spearman")
> plot(as)
> plot(as,layout="sam",vertex.size=8)
> ls(as)
[1] "alpha"         "chains"        "data"          "method"
[5] "p.values"      "probabilities" "sigma"         "theta"
[9] "threshold"
> as$theta
     Frtl Agrc Exmn Edct Cthl In.M
Frtl    0    0    1    0    0    1
Agrc    0    0    0    1    0    0
Exmn    1    0    0    1    1    0
Edct    0    1    1    0    0    0
Cthl    0    0    1    0    0    0
In.M    1    0    0    0    0    0
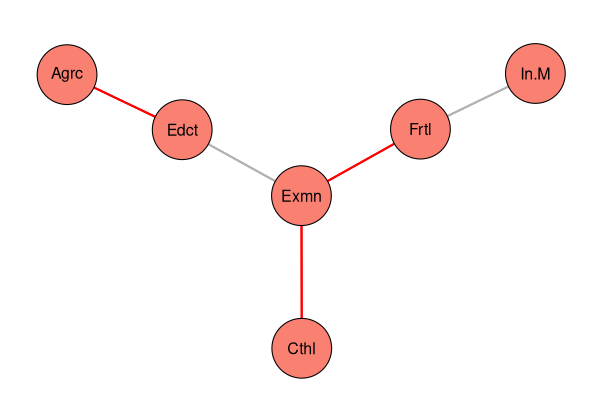
The theta object contains the adjacency matrix with the edges for the found
graph. For more details consult the package vignette:
vignette(package="snha","tutorial") or the manual package of the package
?snha or ?'snha-package'.
Author and Copyright
Author: Detlef Groth, University of Potsdam, Germany
License: MIT License see the file LICENSE for details.
Contributors
The following persons have contributed to the package with ideas, testing, etc.:
- Michael Hermanussen (Aschauhof, the algorithm idea)
- Masiar Novine (University of Potsdam, evaluating different data generation methods and comparing the algorithm swit other approaches)
- Tim Hake (University of Potsdam, Python port and critical discussions about directed edges)
- Bernhard Bodenberger (University of Potsdam, evaluating the bootstrap performances and different parts of the algorithm)
- Cedric Moris (University of Potsdam, evaluating different extensions of the basic algorithm)
Bug reporting
In case of bugs and suggestions, use the issues link on top.