bhulston/PyMongo-ML
Using MongoDB database in conjunction with Python to make predictions on housing prices
PyMongo-ML
Using MongoDB database in conjunction with Python to make predictions on housing prices
Data processing
Split the data:
Then we scale the data using a standard scaler, giving the values a mean of 0 with unit variance of 1
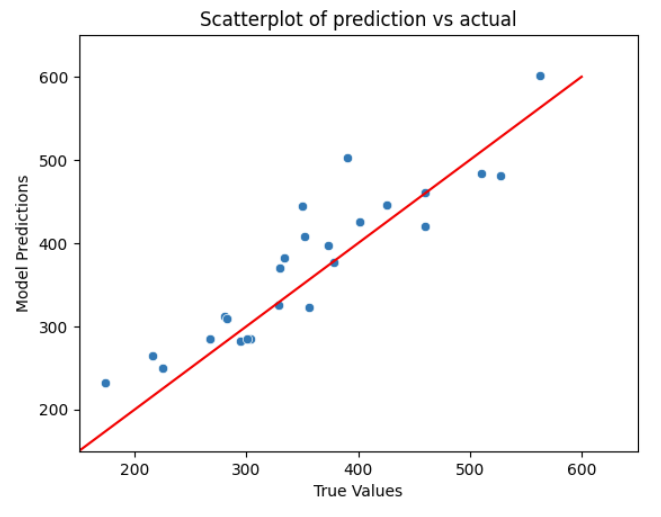
Model building
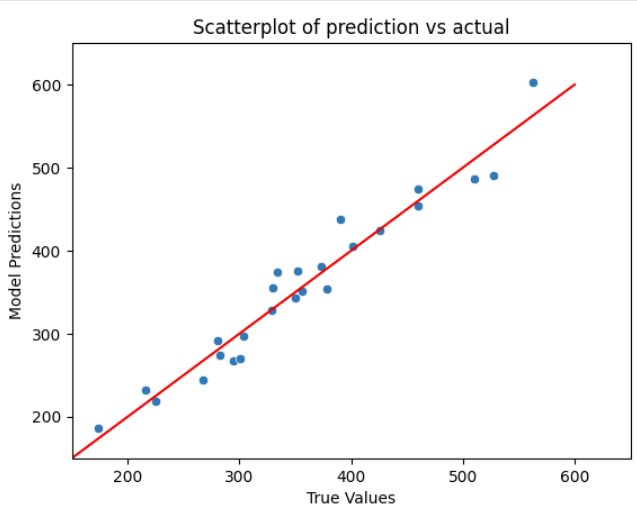
Off the bat with a simple linear regression model, we achieve an R^2 of 94.5% and a MSE of 498
- The data looks pretty linear already:

SHAP results
SHAP is a framework (and python package) that allows us to dive into how features contribute, and affect a model
-
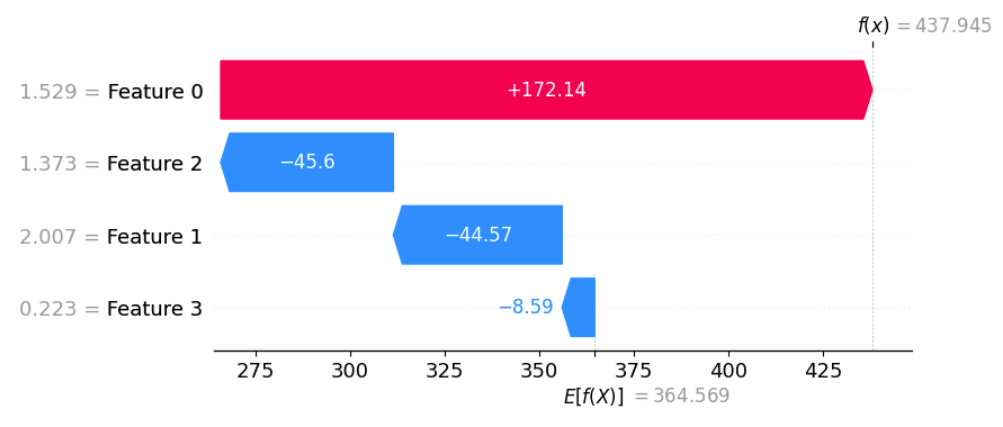
Waterfall visual that explains how predictions are made :

-
The beeswarm plot quantifies SHAPely values for each data point and each feature, which measure the impact on the difference from the expected value(mean) and the actual predicted value
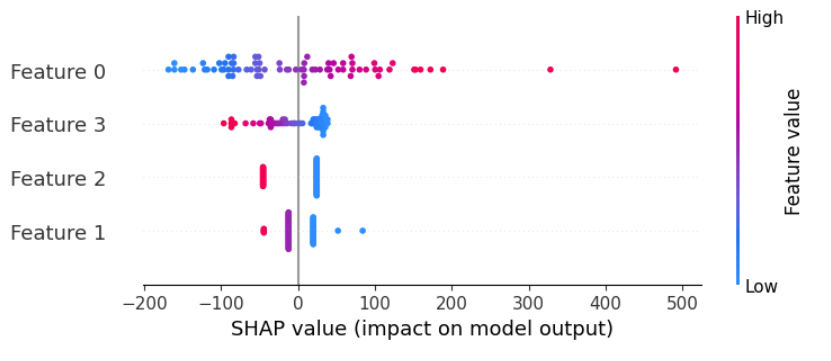
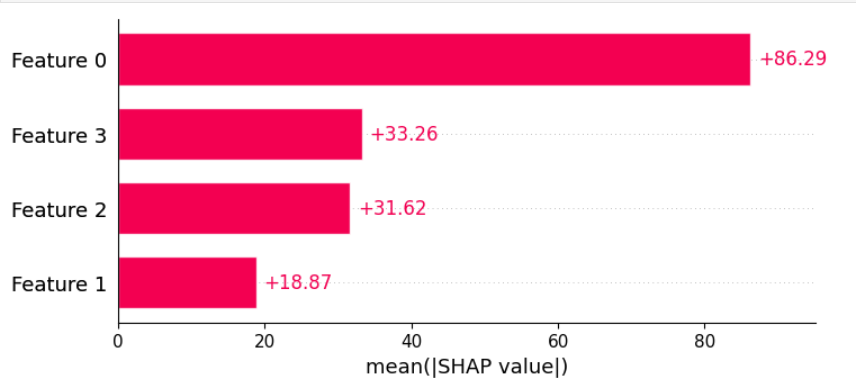
- The bar graph is a more clear visualization that takes the absolute values of the SHAP values for each feature, which gives us the estimated feature value
Comparing other models
- Created another 2 models, first using only the most important feature, and the 3 most important features from SHAP
- Looking at the graphs, we can see more deviation from the diagonal line in the scatterplot with these new models
Comparing MSE, we can see that using only one feature results in 1876 MSE and with 3 features, 963 MSE.
This is much higher in comparison to just using all features where we achieved an MSE of about 500