RezuwanHassan262/Titanic-EDA-and-Survival-Prediction
This project aims to investigate the factors (Age, Class, Gender, etc)that contributed to survival in the tragic sinking of the Titanic and predict the survival chances of passengers based on some provided features.
Practice work: Titanic Exploratory Data Analysis and Survival Prediction
This project aims to investigate the factors (Age, Class, Gender, etc)that contributed to survival in the tragic sinking of the Titanic and predict the survival chances of passengers based on some provided features.
This was the dataset: Titanic - Machine Learning from Disaster.
The Titanic's sinking remains one of history's most infamous maritime tragedies. This project explores the Titanic dataset to identify patterns and factors influencing passengers' survival chances and tries to predict a passenger's survival chance based on those factors using different machine learning models.
This repository seeks to offer a detailed examination of the key variables involved. The features present in the dataset are,
- PassengerId
- Survived (target variable)
- Pclass (passenger class)
- Name
- Sex
- Age
- SibSp (number of siblings/spouses aboard)
- Parch (number of parents/children aboard)
- Ticket
- Fare
- Cabin
- Embarked (port of embarkation)
Analysis and Workflow
Data Cleaning: Addressing missing values, fixing data types, and preparing the dataset for further analysis.
Exploratory Data Analysis: Using descriptive statistics and visualizations to examine variable distributions and uncover relationships.
Feature Engineering Developing new features or modifying existing ones to represent the patterns within the data better.
Statistical Analysis: Pinpointing and ranking key factors that significantly impact survival outcomes.
Survival Prediction: Applying various machine learning models to estimate a passenger's likelihood of survival based on these factors.
Findings and Observations from the Data
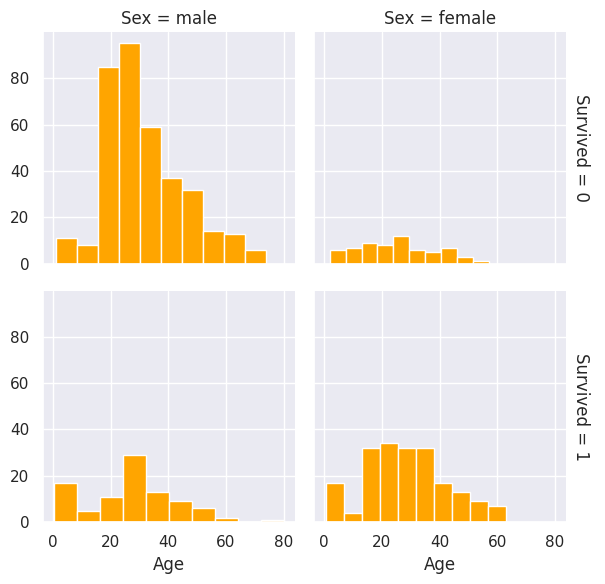
From the figure above, we can see that,
- The age distribution of passengers varies across different combinations of sex and survival. For both males and females, the age distribution suggests that younger passengers were more likely to survive.
- There might be noticeable differences in the age distributions between males and females within each survival category.
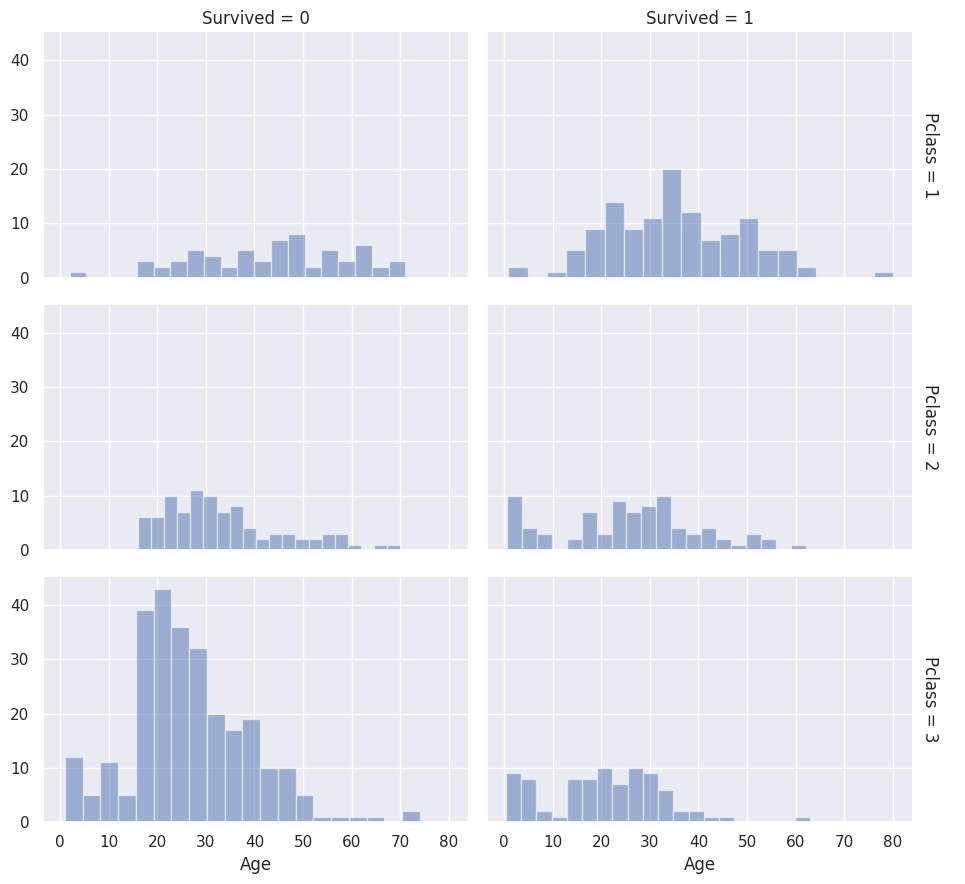
From the figure above, we can see that,
- Younger passengers in Pclass 3 have a higher density among those who didn't survive.
- Older passengers are more prevalent in Pclass 1, and a larger proportion of them survived compared to the other classes.
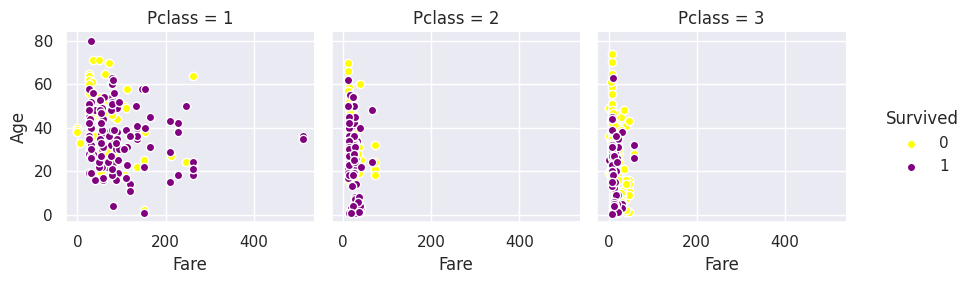
From the figure above, we can see that,
- Scatterplot indicates that the survival rates vary significantly with both age and class.
- Passengers who paid higher fares(Pclass=1) have a better survival rate. indicated by more purple points (survived) at higher fares.
- Age distribution is not strongly correlated with survival as fare.
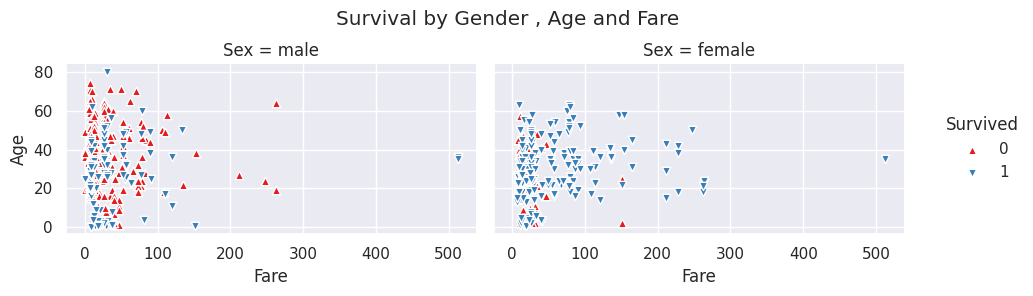
From the figure above, we can see that,
- Younger passengers, especially females, show better survival outcomes.
- Among males, survival appears less dependent on age compared to females.
- Most males who survived are concentrated in the lower fare range.

From the figure above, we can see that,
- Passenger class and gender heavily influenced survival. (Females in higher classes had the best chances of survival, while males in third class fared the worst.)
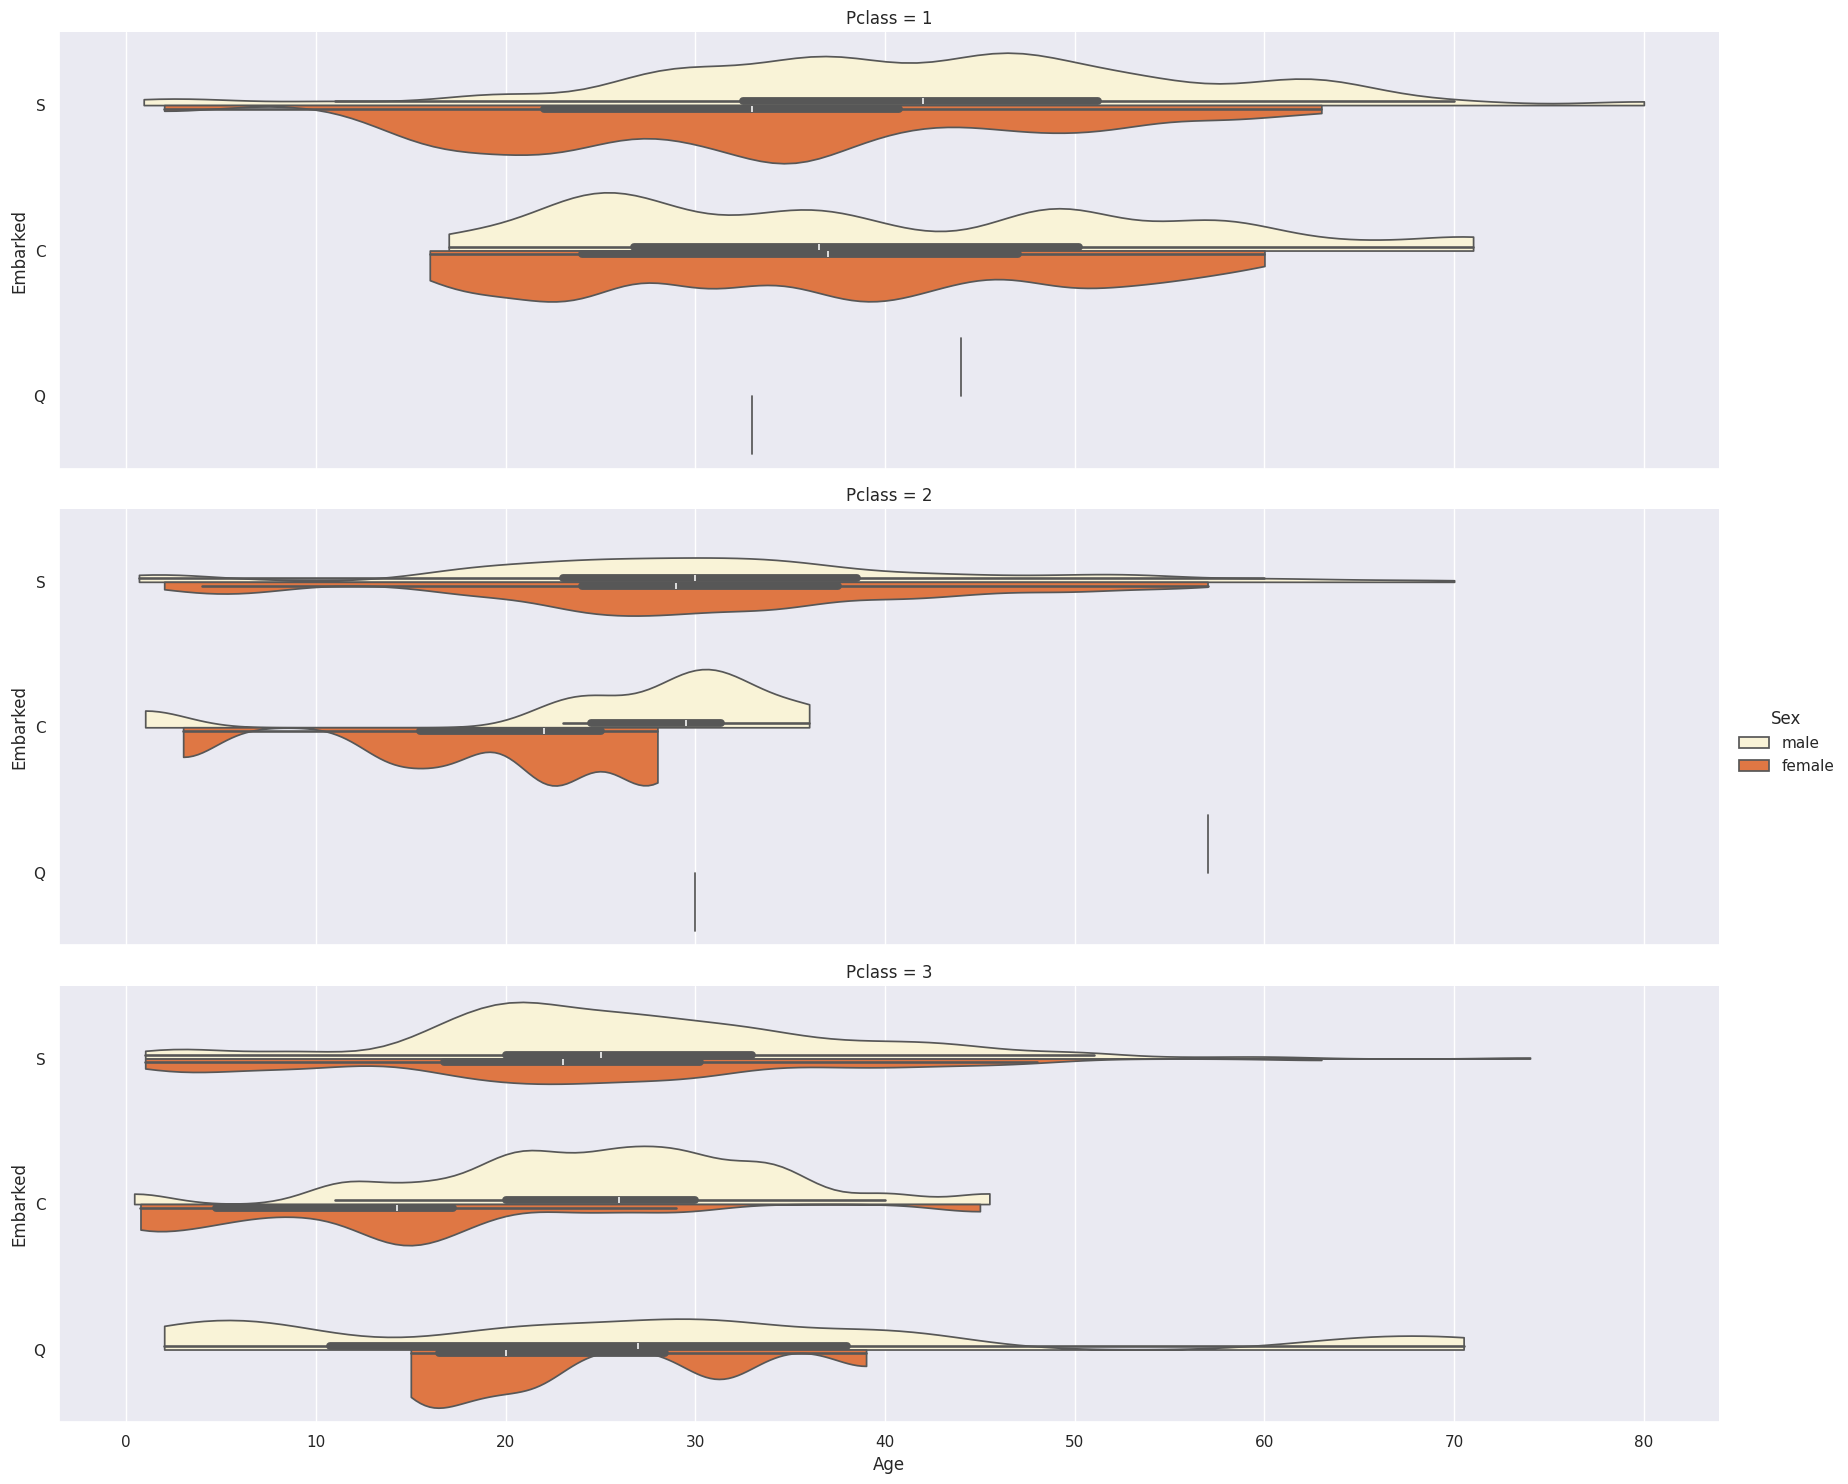
From the figure above, we can see that,
- First-class passengers are generally older, while third-class passengers tend to be younger.
- Female passengers often show a different age distribution compared to males, especially in third class.
- The port of embarkation appears to influence the distribution of ages, suggesting potential socioeconomic or regional patterns.

From the figure above, we can see that,
- 1st class median line is coming around fare $80 for embarked value 'C'.
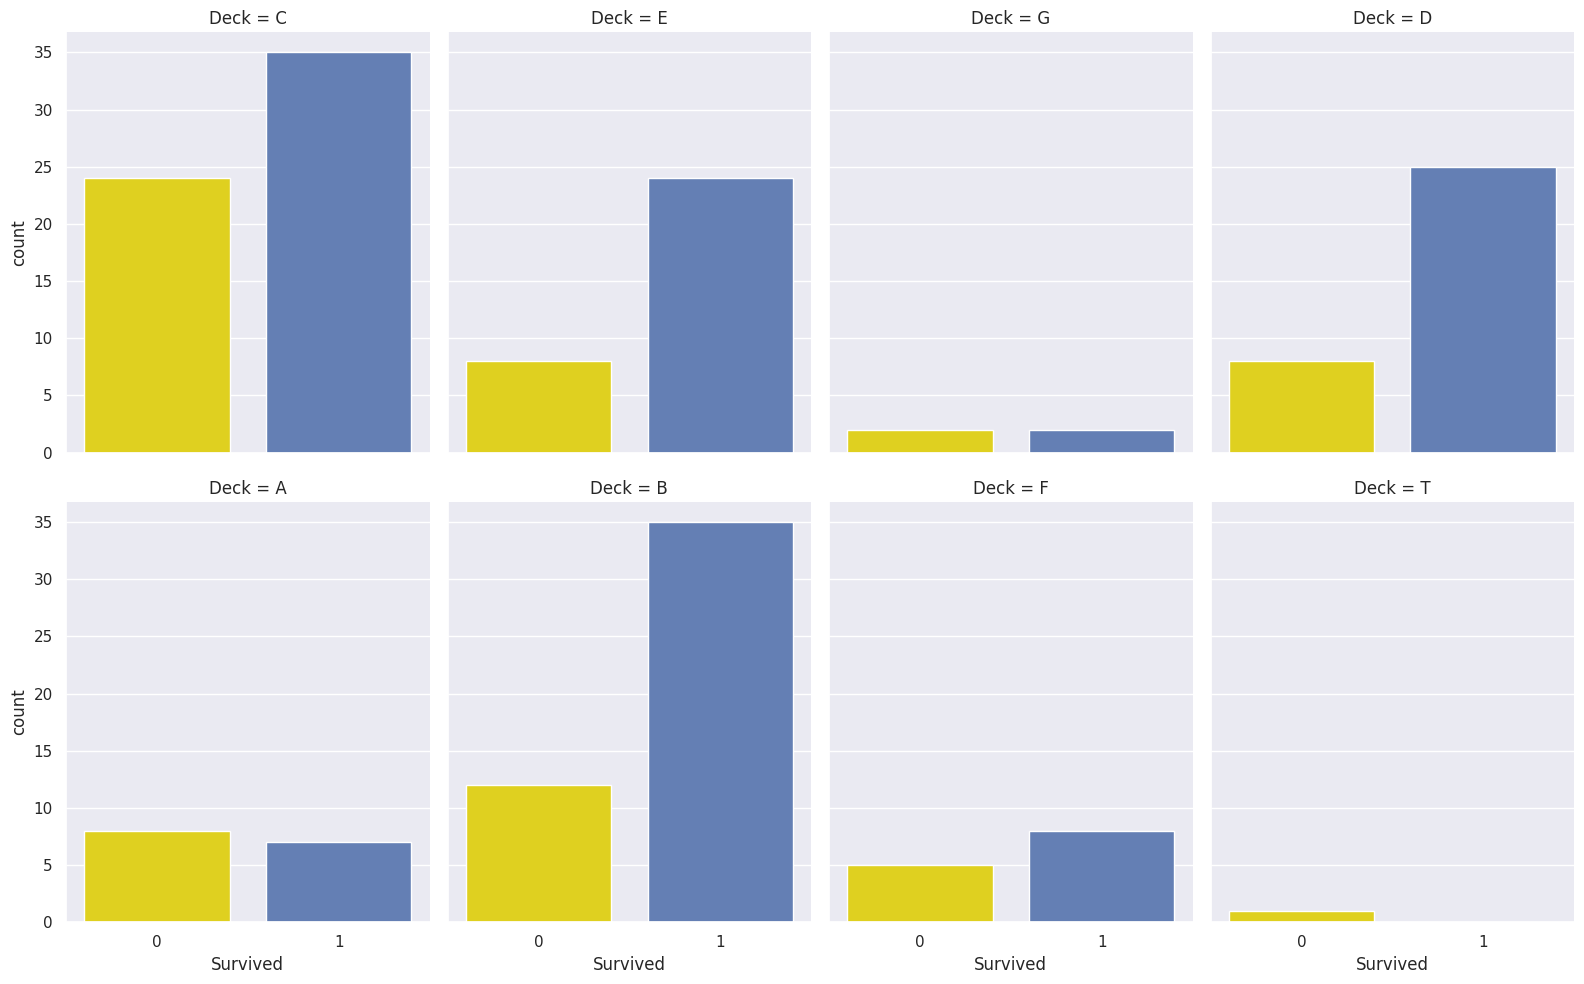
From the figure above, we can see that,
- Some decks (B/C) have a higher number of survivors.
- Equal number of survivors from deck G.
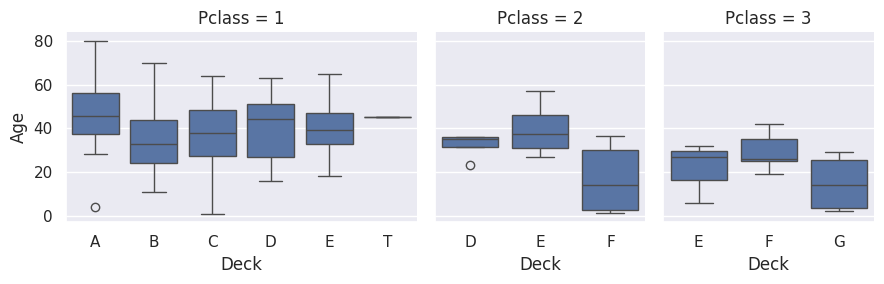
From the figure above, we can see that,
- Deck A has a higher proportion of older passengers in Pclass 1 compared to Pclass 3
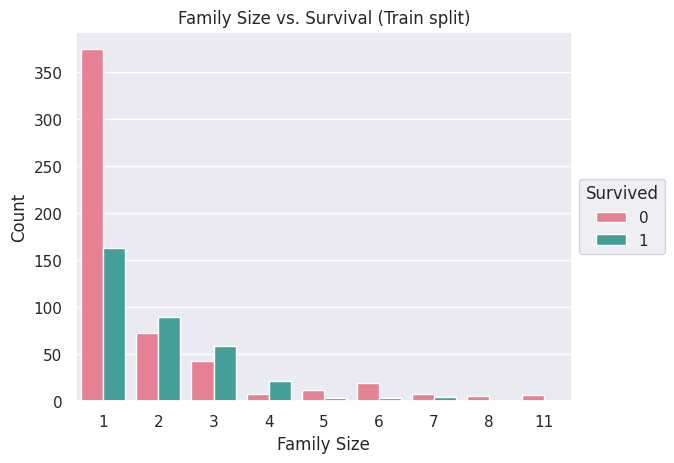
From the figure above, we can see that,
- The singletons survived and died the most.
- The greater the family size the less likely they are to survive.
Feature Importance

The factors that were most important to predict the survival chances of passengers are ranked above using different approaches.
- Left: Feature Importances By Random Forest Model
- Middle: Feature Importances By Gradient Boosting Model
- Right: Feature Importances By SelectKBest
Observation: All three figures suggest that a person's gender, age and the fare they paid were the most crucial factors in determining their chances of surviving the Titanic disaster.
Predicting Survival using ML algorithms
I tried to predict the survival chances of passengers using different ML algorithms, Those are mentioned below with accuracy and relevant metrics.
| Algorithm | Performance | Metric |
|---|---|---|
| Linear Regression | 52.6 | Accuracy |
| Logistic Regression | 75.6 | F1 score (Mean) |
| Random Forest | 10.5 | F1 score (Mean) |
| Random Forest (Hyperparameter Tuned) | 20.3 | Mean Absolute Error |
| AdaBoost | 74.9 | F1 score (Mean) |
| Gradient Boosting | 88.9 | F1 score (Mean) |
| Custom Ensemble Model | 18.1 | Mean Absolute Error |