Crunch-io/crunchtabs
Report generation for Crunch and generic datasets in R
crunchtabs
Crunchtabs allow for the automatic generation of toplines, crosstabulation and codebooks directly from a crunch dataset.
![]()
Quick Start
For a broader introduction please see our introductory vignette. For codebooks, see codebooks
1. Install tinytex
To make PDF reports, you'll need a working LaTeX installation. One way to get this is with the tinytex package. Or, see https://www.latex-project.org/get/ to install everything. We strongly recommend installing tinytex because it reduces the number of potential problems.
install.packages('tinytex')
tinytex::install_tinytex()
2. Install crunchtabs
# install.packages("remotes")
remotes::install_github("Crunch-io/crunchtabs")
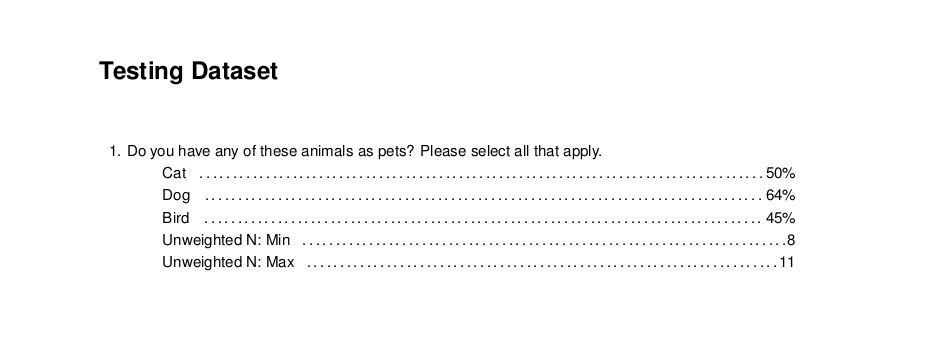
Create a Topline
Generating a topline report is quick and easy!
# library(crunchtabs)
# login()

ds = loadDataset("Example dataset")
# Use ds = newExampleDataset() if not found!

toplines_summary <- crosstabs(dataset = ds)
writeLatex(toplines_summary, filename = "output", pdf = TRUE) # output.pdf will be written
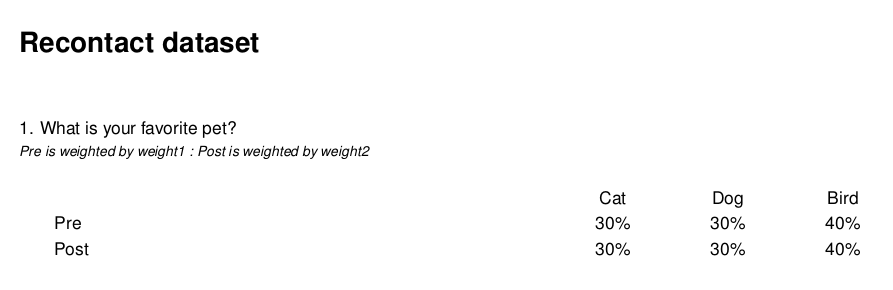
Create a recontact or pre/post Topline
Let's say you have a datasaet where you have asked the same question twice. Once "before" and once "after". recontact_topline generates a report that shows these two side by side as if they were a categorical array. Making it easier for reviewers to identify differences over time.
The function assumes your "before" and "after" questions are named in the same way with a suffix.
- q1_pre
- q1_post
- q3_pre
- q3_post
<!-- -->
# library(crunchtabs)
# login()
ds <- loadDataset("Your Recontact Survey")
rc <- recontact_toplines(
  ds,
  questions = c("q1", "q3"), # The base question name without suffixes
  suffixes = c("_pre", "_post"), # The suffixes
  labels = c("Pre", "Post"), # The labels associated with the pre/post
  weights = c("weight1", "weight2") # The weights associated with the pre/post
)

writeLatex(rc, pdf = TRUE)
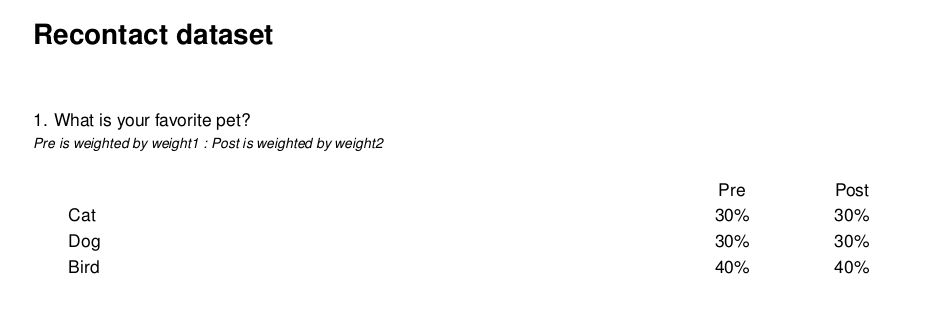
Depending on your preferences you can also flip grids if have more categories than waves:
theme <- themeNew(
  default_theme = themeDefaultLatex(),
  latex_flip_specific_grids = c("q1")
)

writeLatex(rc, theme = theme, pdf = TRUE)
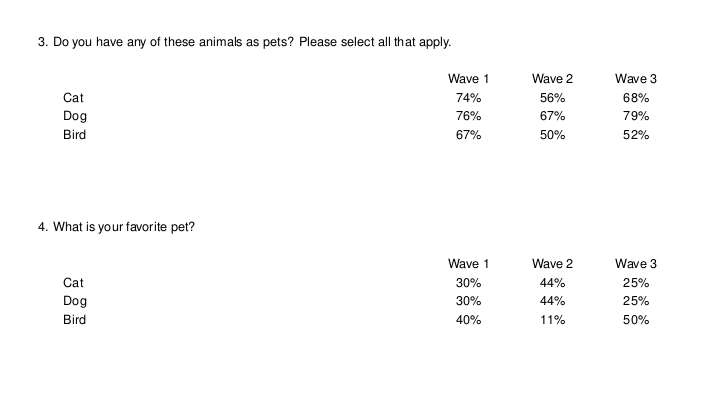
Create a Tracking Report
While recontact reports are designed for questions asked in the same dataset, we also have the ability to present questions asked in multiple datasets in a similar fashion. There are some critical nuances here that should be understood - we recommend reviewing the eponymously named vignette.
# library(crunchtabs)
# login()

theme <- themeNew(
  default_theme = themeDefaultLatex(),
  latex_flip_grids = TRUE
)

ds1 <- loadDataset("My DS Wave 1")
ds2 <- loadDataset("My DS Wave 2")
ds3 <- loadDataset("My DS Wave 3")

ct <- trackingReport(
  dataset_list = list(ds1, ds2, ds3),
  vars = c("question_alias1", "question_alias2", "question_alias3"),
  wave_labels = NULL
)

writeLatex(ct, pdf = TRUE, theme = theme)
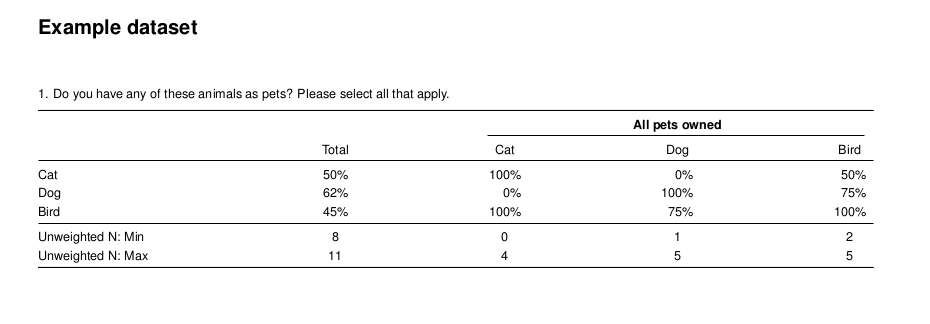
Create a Cross Tabulation
The only additional step required for a cross tab report is to create a banner object. Then, setting it as the banner argument for the crosstabs function. Below, we create a cross tabulation report that shows the type of pet(s) respondents own to our survey for every question in the survey. Once you have run the code, we encourage you to open the resulting output.pdf file. Inside of the report you will find a cross tabulation of all questions by pet ownership.
# library(crunchtabs)
# login()

ds = loadDataset("Example dataset")
# Use ds = newExampleDataset() if not found!

ct_banner <- banner(ds, vars = list(`banner 1` = c('allpets')))
ct_summary <- crosstabs(dataset = ds, banner = ct_banner) # banner parameter set here
writeLatex(ct_summary, filename = "output", pdf = TRUE) # output.pdf will be written
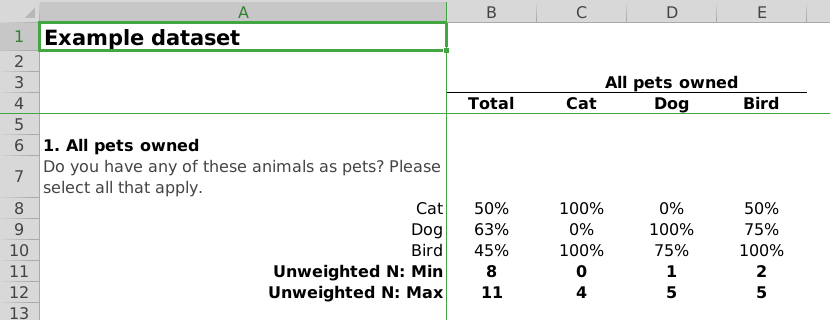
Excel
To create documents in excel, the process is the same as that for creating PDF reports. However, in the last line of our example scripts we use writeExcel instead of writeLatex while also removing the pdf = TRUE argument. As with PDF reports, there are a large amount of options that can be set to adjust the look and feel of the resulting Excel spreadsheets.
# ... cross tab
writeExcel(ct_summary, filename = "output") # output.xlsx will be written

# ... topline, not yet implemented
# writeExcel(toplines_summary, filename = "output") # output.xlsx will be written
Generating Codebooks
Generating a codebook is easy!
# library(crunchtabs)
# login()

ds = loadDataset("Example dataset")
# Use ds = newExampleDataset() if not found!

writeCodeBookLatex(ds)